Processes used to analyse selections using crosstab analysis.
Any saved selection may be analysed using crosstab analysis, or breakdowns as they are often called.
For example a client may give you a brief for some prospect data and wish to know the distribution of industry codes within that selection.
Cross-tab reports are very easy to generate in OSCAR.
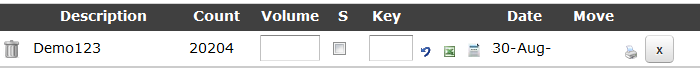
First click the Place an Order shortcut on the top toolbar, and next to each selection you will see a small Excel icon, click this.
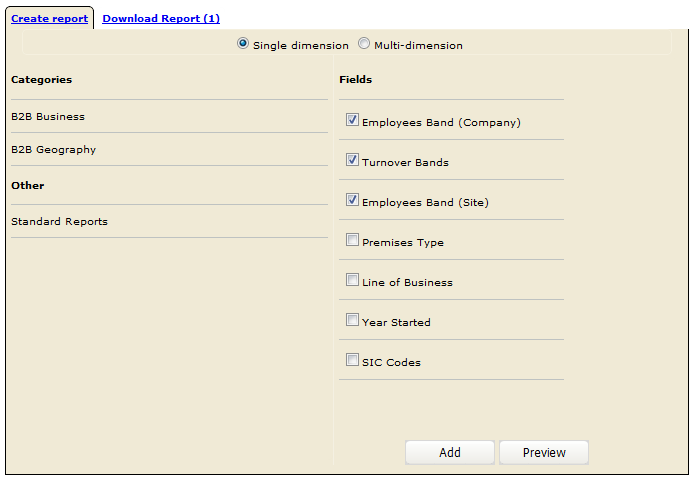
The crosstab wizard will load as shown below. As you will see, there are 2 types of crosstab, single and multi.
Single provides a simple breakdown of each selected attribute on a separate tab in the resulting Excel report.
Multi creates a pivot table of 2 attributes.
First select the category that contains the attributes you want to use and select their checkbox. You can select up to 3 on single.
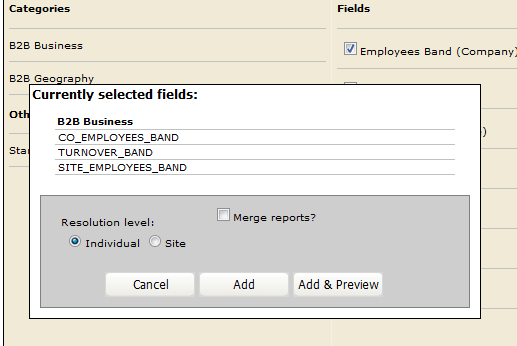
Now click Add. Add will allow you to continue adding to your selections and will load the screen below.
Click Add here will take you back to the first screen so that you can add to you report, or Add/Preview to finalise your report.
We will click Add so we can add in a multi crosstab as well.
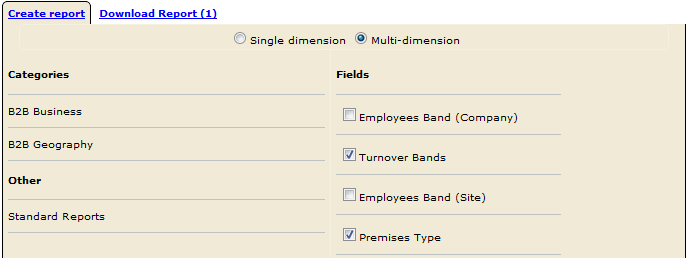
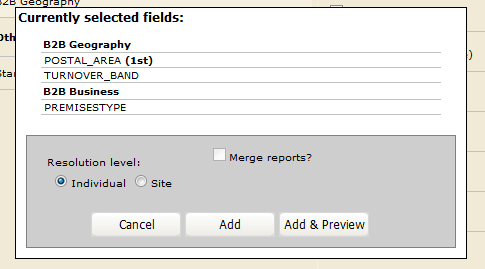
Click the Multi option.
Select the fields you want to pivot (MAX 2 fields for your cross-tab).
Click Add
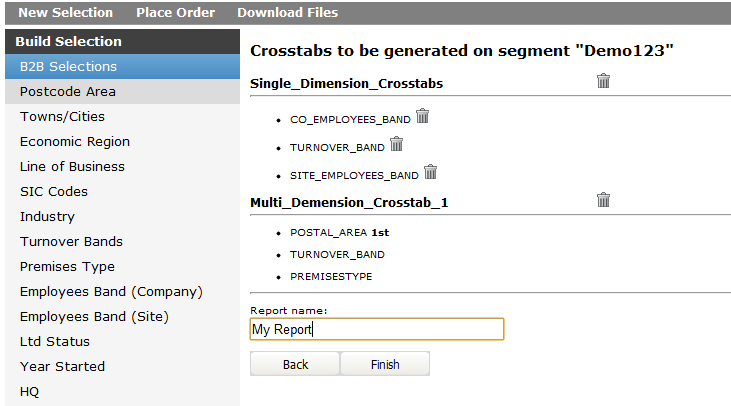
Click Add & Preview and give the report a name and click Finish.
You will receive an email when the report is ready. Go back to the selection and click the Excel icon again. Click the Download Report tab and download the report.
If you have any questions regarding OSCAR, please contact your account manager.
This website uses cookies to improve your experience.AcceptRead More
Privacy & Cookies Policy
Privacy Overview
This website uses cookies to improve your experience while you navigate through the website. Out of these, the cookies that are categorized as necessary are stored on your browser as they are essential for the working of basic functionalities of the website. We also use third-party cookies that help us analyze and understand how you use this website. These cookies will be stored in your browser only with your consent. You also have the option to opt-out of these cookies. But opting out of some of these cookies may affect your browsing experience.
Necessary cookies are absolutely essential for the website to function properly. This category only includes cookies that ensures basic functionalities and security features of the website. These cookies do not store any personal information.
Any cookies that may not be particularly necessary for the website to function and is used specifically to collect user personal data via analytics, ads, other embedded contents are termed as non-necessary cookies. It is mandatory to procure user consent prior to running these cookies on your website.